
Introduction
I stepped onto a dusty substation yard near Bakersfield at 6:10 a.m., January 2022, and the inverters were already humming low. Utility scale battery storage sat behind the fence, quiet but ready. Two weeks before, the same site clipped 5.2 MWh due to a firmware bug that confused state of charge reporting—small numbers, but real money for the offtaker. I have spent over 15 years in grid projects, and I still feel a knot when I see a control room with blind spots. In my work, I focus on utility scale battery energy storage systems that must answer when the dispatcher calls. We logged a 97.4% round-trip efficiency at 0.5C on a cool day; at 38°C, it went down by 1.1%. That shift matters for revenue and for heat stress on the cells (honestly, I prefer hard data over slogans). So, where do projects stumble, and how do we avoid repeats? I will compare what I have seen go wrong with what now works better—step by step.
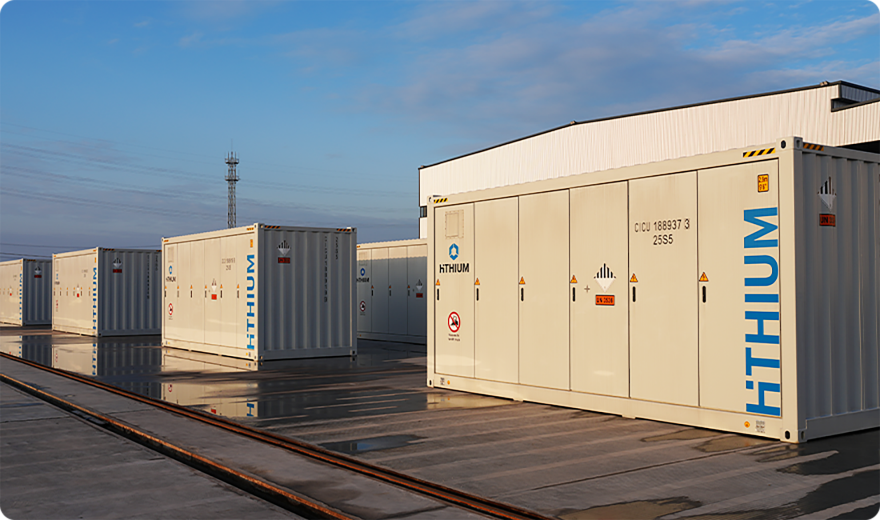
This is not a sales pitch. It is a worker’s view with a notebook in hand and dust on the boots—let us move from familiar promises to tested choices.
The Deeper Layer: What Actually Breaks First
What fails first?
From my logs, traditional fixes hide fragile parts. Controls sit on top of the stack, but integration is the floor. Older sites leaned on a patchwork SCADA link and a single PLC. A minor comms timeout froze power commands for 47 seconds at an ERCOT site in July 2023—right at peak. The market penalty was $31,800 for that hour. This is why I push for distributed logic and edge computing nodes at the inverter skid. When the master controller hiccups, the power converters should still follow a safe fallback curve. Look at thermal, too. Air-cooled racks sag under high ambient. I have seen 3% capacity fade by month 18 when fan curves were mis-tuned. Liquid cooling with a proper delta-T profile, plus cell-level BMS that respects state of health, holds the line much longer. I am strict on UL9540A test reports; soft summaries mislead. I want the full burn data, vent rates, and the enclosure pressure profile—no exceptions.
Financing brings a second trap. Contracts often reward nameplate but ignore usable energy across seasons. I tell owners to model at least three curtailment modes, including inverter clipping and DC bus voltage derates at high temperature. Do not stop at Pmax. Measure the shape. A 112.5 MW/225 MWh system outside Odessa, Texas, lost about 2.7 MWh daily due to conservative anti-islanding settings. On paper, it looked safe. In practice, it was wasteful. After a firmware revision tightened frequency ride-through per NERC PRC‑024, the site reclaimed most of that slice—one parameter, real dollars. I felt annoyed when I learned it took six weeks to approve that change—my coffee went cold during the third cross-vendor call—and I still push teams to agree on grid-code profiles during FAT, not after COD.
Comparative Insight: What’s Genuinely Better Now
Real-world Impact
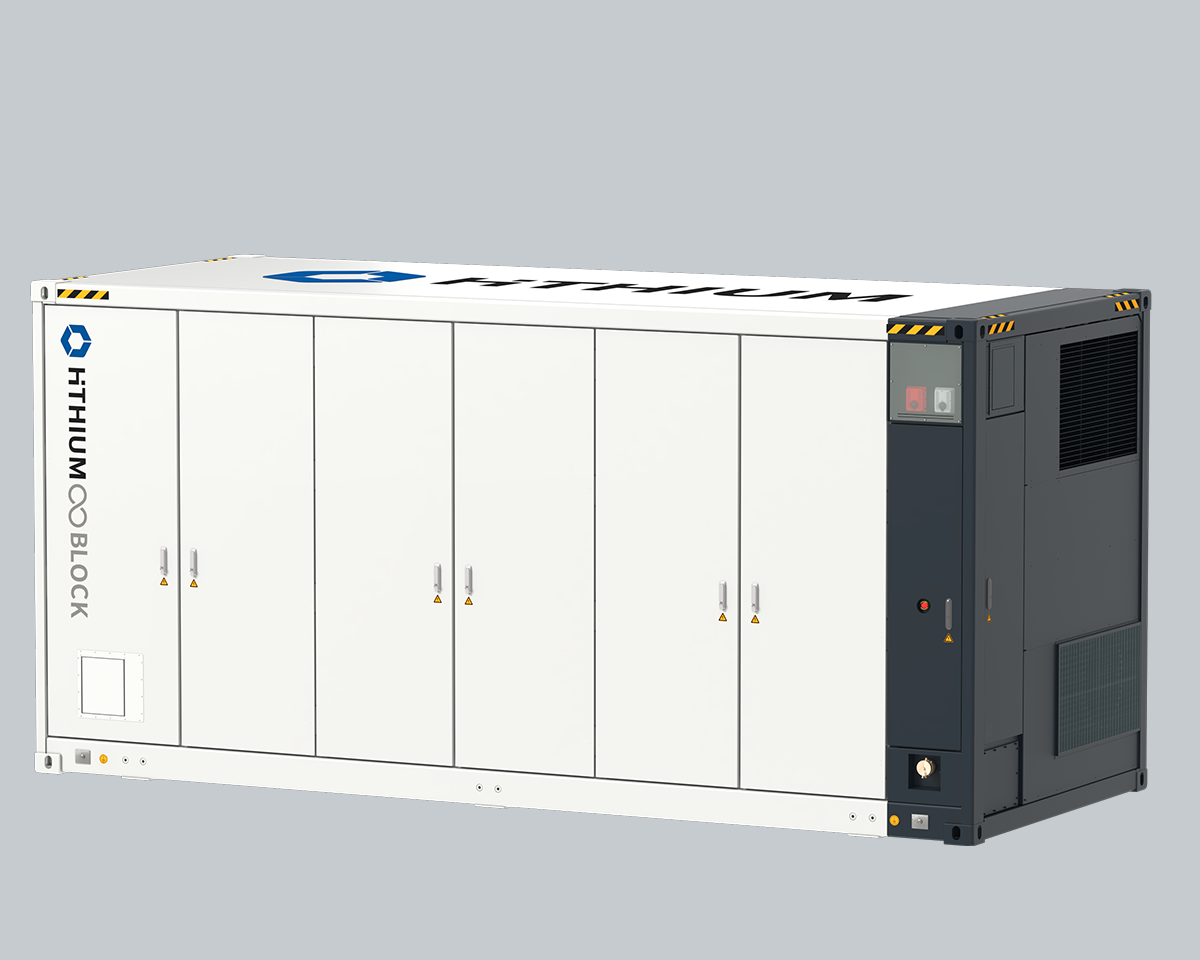
We have moved from single-point brains to layered control. In 2019, many plants relied on a central controller that micromanaged every inverter. Today, a better pattern is hybrid: the site controller sets aggregate setpoints, then leaves fast loops to the inverter and rack BMS. The result is smoother response within 250 ms for frequency events, without thrashing the cells. When I compare DC‑coupled solar‑plus‑storage to AC‑coupled peers, I lean DC in markets with clipped PV. The DC bus shares conductors, so you capture high-noon surplus without extra conversion. In CAISO, we measured 4–6% higher net energy at the plant fence over a full summer block, all fees included. On cabinets, I favor liquid-cooled LFP racks for hot sites, with a coolant loop that holds 25–28°C at the core. Air works in cooler zones, yet fan noise and dust have a cost—once, I could hear inverters singing under partial load while a sand layer clogged the filters.
Forward-looking, I see “self-healing” dispatch taking root. The best utility scale battery energy storage systems use health-aware scheduling. They weigh cell impedance rise, forecast ambient heat, and market prices at once. Not theory. We ran a pilot in April 2024 on a 50 MW/100 MWh site near Barstow. The controller cut peak C‑rate by 0.1C during heat waves, and revenue still grew 3.4% because availability stayed high. Meanwhile, safety is more routine and less dramatic when the fire detection and HVAC talk to the BMS over deterministic links, not best‑effort Ethernet. I also compare shipping and service. A container that arrives 18 days late can burn $40,000 in crane and security standbys. Choose vendors that publish lead times by port, not brochure averages. It sounds plain, yet it saves weekends and tempers.
How I Judge Options: Three Metrics That Do Not Lie
I carry three checks on every visit, and they have spared me from expensive lessons.
First, controls integrity. I simulate a comms loss between the site EMS and one inverter block. If fallback droop holds within ±1% of setpoint and the plant still meets a 500 ms response for a 10 MW step, we pass. If not, I push for local logic changes before we sign. Second, thermal reality. We run a 4‑hour discharge at 0.75C with ambient above 32°C and watch coolant deltas and rack-to-rack variance. Anything over 3°C spread flags a layout or pump issue. Third, service proof. I ask for the last three closed work orders with time‑to‑resolution and parts traceability. If the vendor cannot show that, we walk. Advisory tone aside, I have felt the heat—like the day a missing gasket kept a 20 MWh block idle for 36 hours—so I prefer solutions that spare crews from avoidable scrambles. Summing up, compare brains, cooling, and response under stress. Do that, and your plant earns, not just runs. For further reading and component depth, I keep a tab on HiTHIUM resources when planning field checks.