
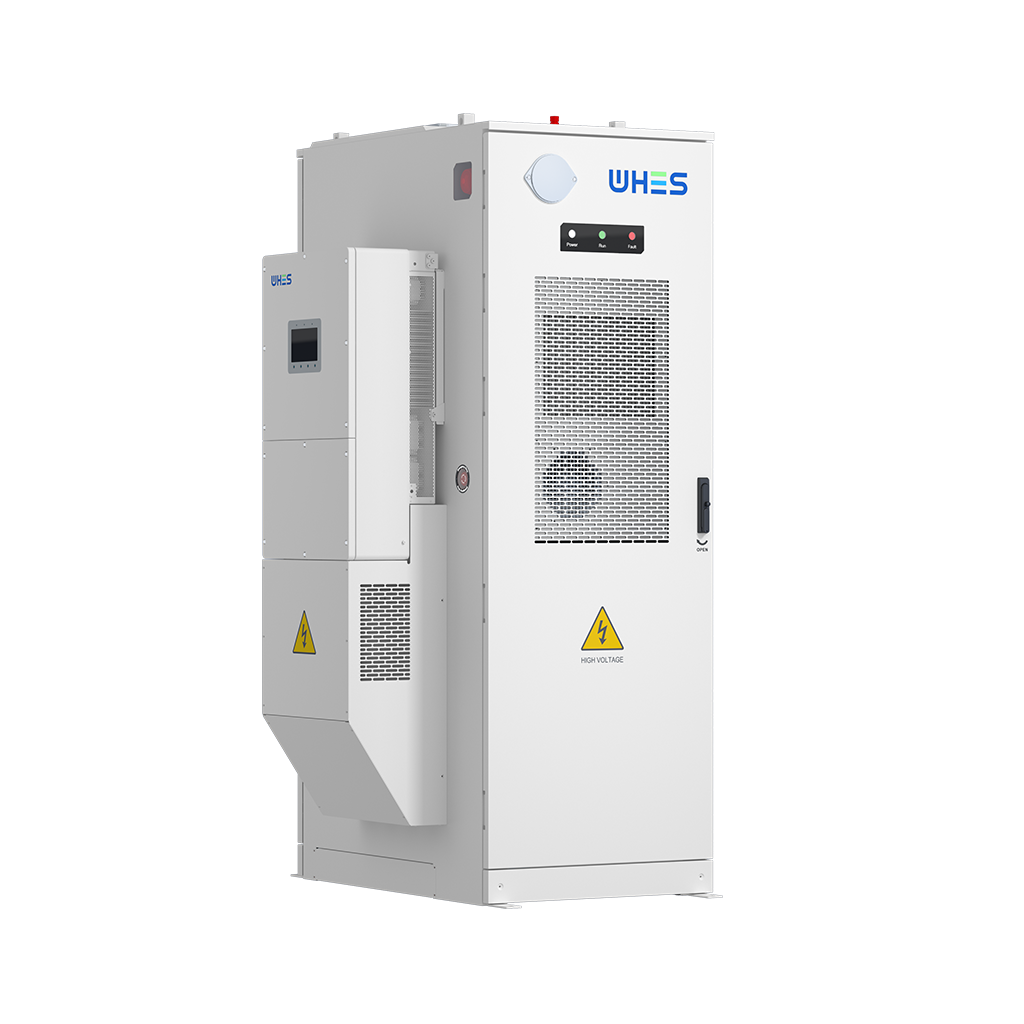
Opening: why a data lens changes everything
The story begins with numbers — not slogans. When grid operators and project engineers talk about frequency response, they rely on measurable compensation rates for active and reactive power to keep the system stable. Drawing on real deployment patterns and lab bench tests, this piece examines how multi‑megawatt hybrid energy storage platforms perform under droop control. If you want a quick practical reference for design and procurement, start here — and consider how a home battery energy storage system scales the same control principles from kilowatts to megawatts.
Why the data-driven approach matters
Frequency droop control directly ties changes in frequency to adjustments in active power (P), while reactive power (Q) compensation governs voltage support. Quantifying those relationships matters because small mismatches cascade: insufficient P response worsens frequency excursions; poor Q handling destabilizes voltage on long feeders. High-profile events — think the Texas 2021 winter storm and repeated California heatwave stress on the ISO — are stark reminders that engineering margins become policy and safety issues when the grid is pushed. Using measured droop curves, response times, and duty‑cycle statistics gives you actionable thresholds for procurement and commissioning.
Key metrics to track (and why they’re honest)
Focus on a few concrete, repeatable metrics: droop slope (%/Hz), ramp rate (MW/s), reactive power bandwidth (MVAr), and sustained duration at rated output. Add state of charge (SoC) profiles and inverter thermal limits to this list — these values reveal how long and how fast a system can deliver. In practice, you’ll want lab-tested P–f curves and Q–V response plots tied to the specific inverter firmware. These numbers translate directly into contractual guarantees and acceptance tests during commissioning.
How multi‑MW hybrid systems behave in the field
Field data shows a pattern: hybrid systems combining batteries with slower, high‑inertia resources can meet aggressive active power ramps for short durations, then rely on stored energy for sustained support. Inverter behavior is critical — grid‑forming topologies handle both droop control and seamless islanding better than grid-following setups. Reactive power is often the unsung hero; adequate Q headroom reduces voltage collapse risk during large transfers. Expect variance by site — thermal constraints, ambient temperature, and SoC all change the realized compensation rates. —
Design trade-offs and common mistakes
Teams routinely under-specify one of three items: inverter peak current capability, reactive power margin, or usable battery energy (usable SoC window). The result is a system that can meet a nominal droop slope in the lab but trips under prolonged stress in the field. Another common mistake is conflating fast transient capability with sustainable power — a platform that can hit a 5 MW/s ramp for two seconds isn’t guaranteed to sustain several megawatts for 15 minutes. Proper acceptance testing must reflect both transient and steady-state duties.
Component selection: inverters, controls, and the three phase battery link
When specifying components, prioritize proven firmware for droop algorithms, robust thermal design for inverters, and battery chemistries with predictable degradation curves. For residential projects scaled up to three‑phase distribution or community microgrids, a three phase battery architecture eases integration with existing switchgear and simplifies balancing. Look for vendors that publish P–f and Q–V curves and provide factory witness testing — that documentation saves months during commissioning. Remember: mass (MW) and control finesse both matter.
Practical checks before you sign the contract
Run these on every proposal: request measured droop curves at multiple SoC states; verify inverter thermal derating tables; demand a timeline for firmware updates and a defined rollback plan. Include clear acceptance criteria that tie to time‑at‑power and ramp‑rate requirements. Ask for field references where systems operated under similar grid conditions to your site — real deployments are the best proof of concept.
Advisory: three golden evaluation metrics
1) Effective Response Time: measure the time from frequency deviation to 90% of targeted active power change. Fast transients need sub-second fidelity. 2) Sustained Energy Margin: confirm usable SoC and guaranteed duration at specified megawatt output (e.g., minutes at X MW). That tells you whether the system is short‑burst only or truly supportive. 3) Reactive Power Bandwidth: ensure the inverter can supply or absorb MVAr across the voltage range you expect — voltage support is non‑negotiable for stability.
Apply these metrics at the RFP stage and during FAT to separate marketing claims from deliverable performance. The outcome is measurable reliability and fewer surprises on day one of operation.
In the end, clear numbers and honest test data steer projects to systems that actually stabilize the grid when it matters most — and that practical value is exactly what WHES brings to multi‑megawatt hybrid deployments. —