
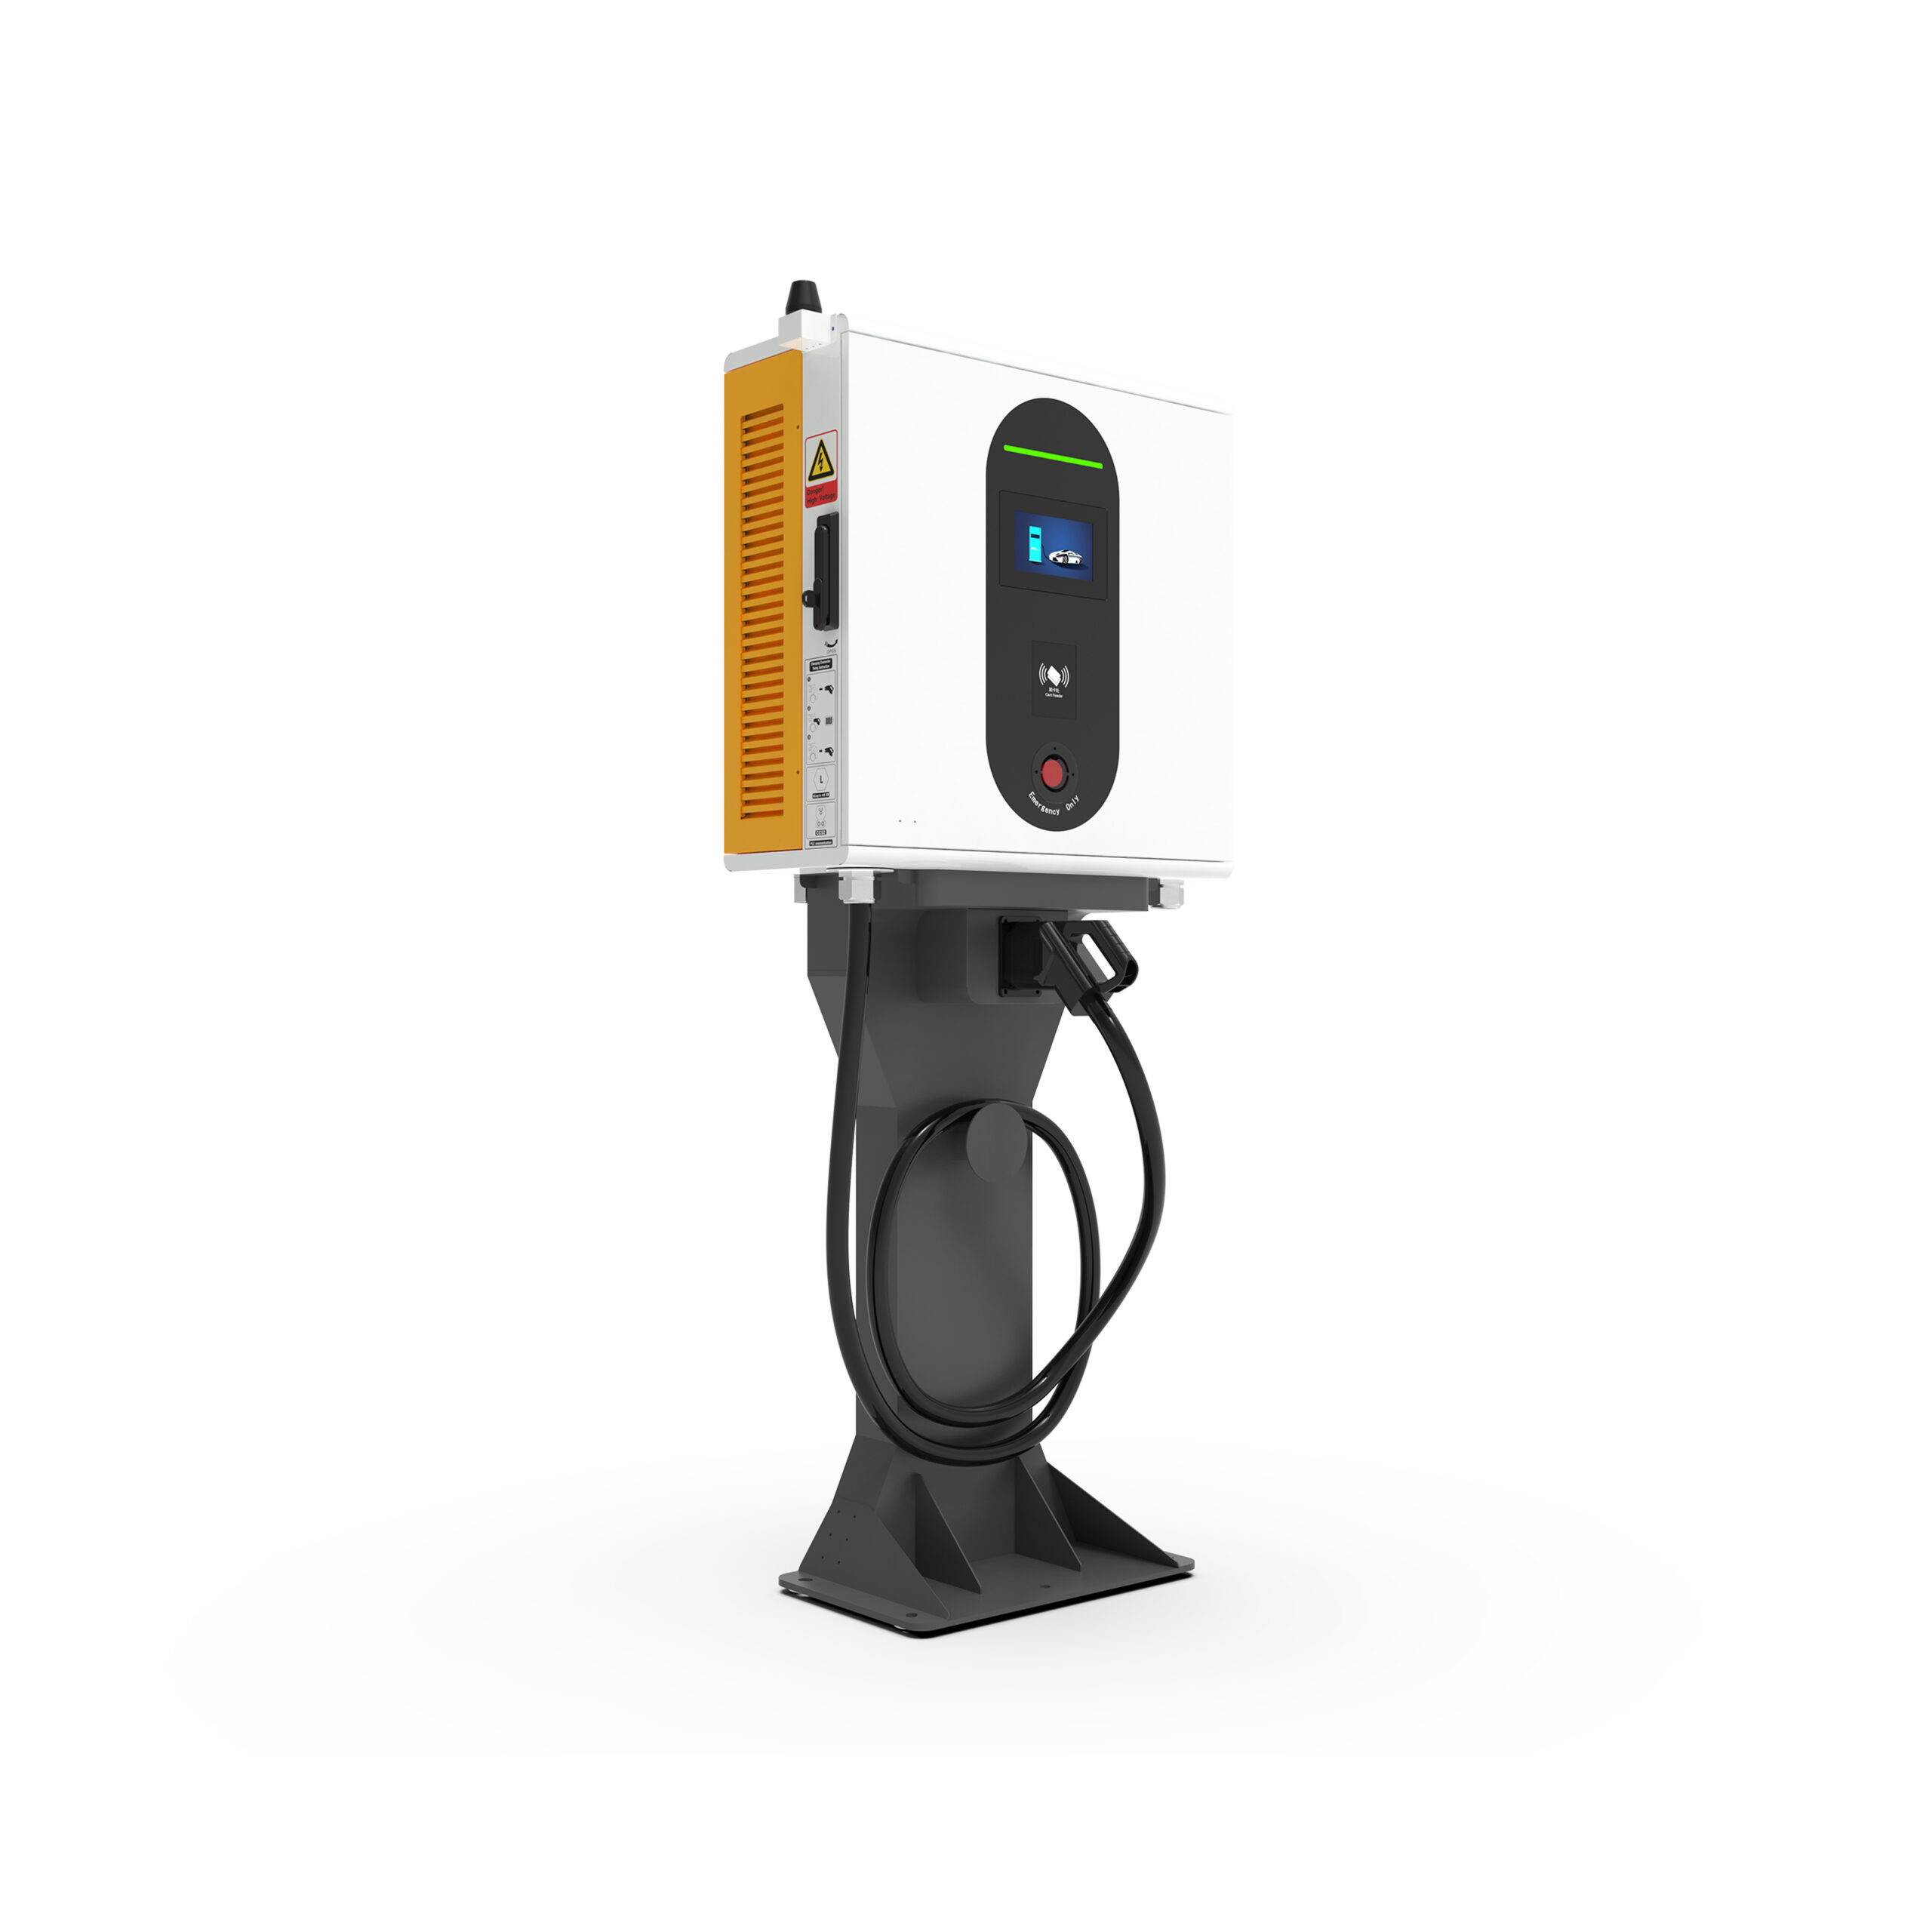
Introduction: A Fast Yard, A Slower Truth
Here’s the twist: speed on paper rarely matches speed on the ground. This story tracks 30kw DC fast charger 110 / 40kw DC charger 110 rollouts at a crowded fleet depot just before dawn. Seven routes stage in, 52 vans line up, and minutes slip; managers see a gap and rush to add a 40kW DC Charging Station to fix it. But the data says otherwise—queue time, handshakes, and heat push real gains off the clock (quietly). So, why does more kW not always equal fewer delays? Why do drivers still wait even when the screen reads “ready”? Look, it’s simpler than you think, yet hidden in the margins: handshake delay, thermal derating, and small site rules. The question isn’t only “How fast?” It’s “How often is fast available?” Let’s open the panel and step into the next layer.

Hidden Bottlenecks the Spec Sheet Won’t Show
Where do the delays really come from?
First, the power path. Power converters ramp and verify; the OCPP backend checks policy; the contactor drops, then rises again if the pilot signal flickers. Each micro step adds seconds, then minutes across a shift—funny how that works, right? In heat, thermal derating cuts output to protect modules. A unit that says 40 kW might give you 28–32 kW for long stretches in summer. Add cable warmth, and the gun grows harder to manage near peak hours. Then there’s grid math: peak-demand windows punish you if many vans plug in at once. So, a “faster” unit can trigger higher tariffs and force you to throttle. The spec does not show those trade-offs; the clock does.
Second, the small frictions. Connector wear adds reseat attempts. The enclosure rating helps, but dust and mist still creep in around busy docks. Without edge computing nodes to run local queue logic, chargers ask the cloud for every decision; latency stacks up. Even the CAN bus chatter between charger and vehicle can nudge start times. Firmware matters most here: poor retry logic equals longer handshakes. Ops teams call this “dead air”—that quiet minute before the first watt flows. When you compare 30 kW to 40 kW, compare “time-to-first electron,” not just peak output. That’s the metric that changes the day. And yes, it lives outside the glossy brochure.
Comparative Outlook: How 40kW Changes the Day-to-Day
What’s Next
Now the forward view. Modern 40 kW designs use modular power blocks, often 10 kW slices, with smarter thermal paths and silicon carbide switches. That means cooler runs and less thermal derating. Dynamic load sharing lets one unit feed several stalls with fair rules, so you avoid tariff spikes during the worst 15-minute window. Pair that with ISO 15118 Plug & Charge, and handshake time drops. Fewer screens to tap, fewer retries. Add better cable cooling or larger conductors, and you hold rated output longer. The result: not just faster, but steadier. That’s where a system sold as EV fleet charging solutions 260 earns its keep—less fuss, more uptime (and fewer morning surprises). It’s a calm gain, not a flashy one—strange but true.
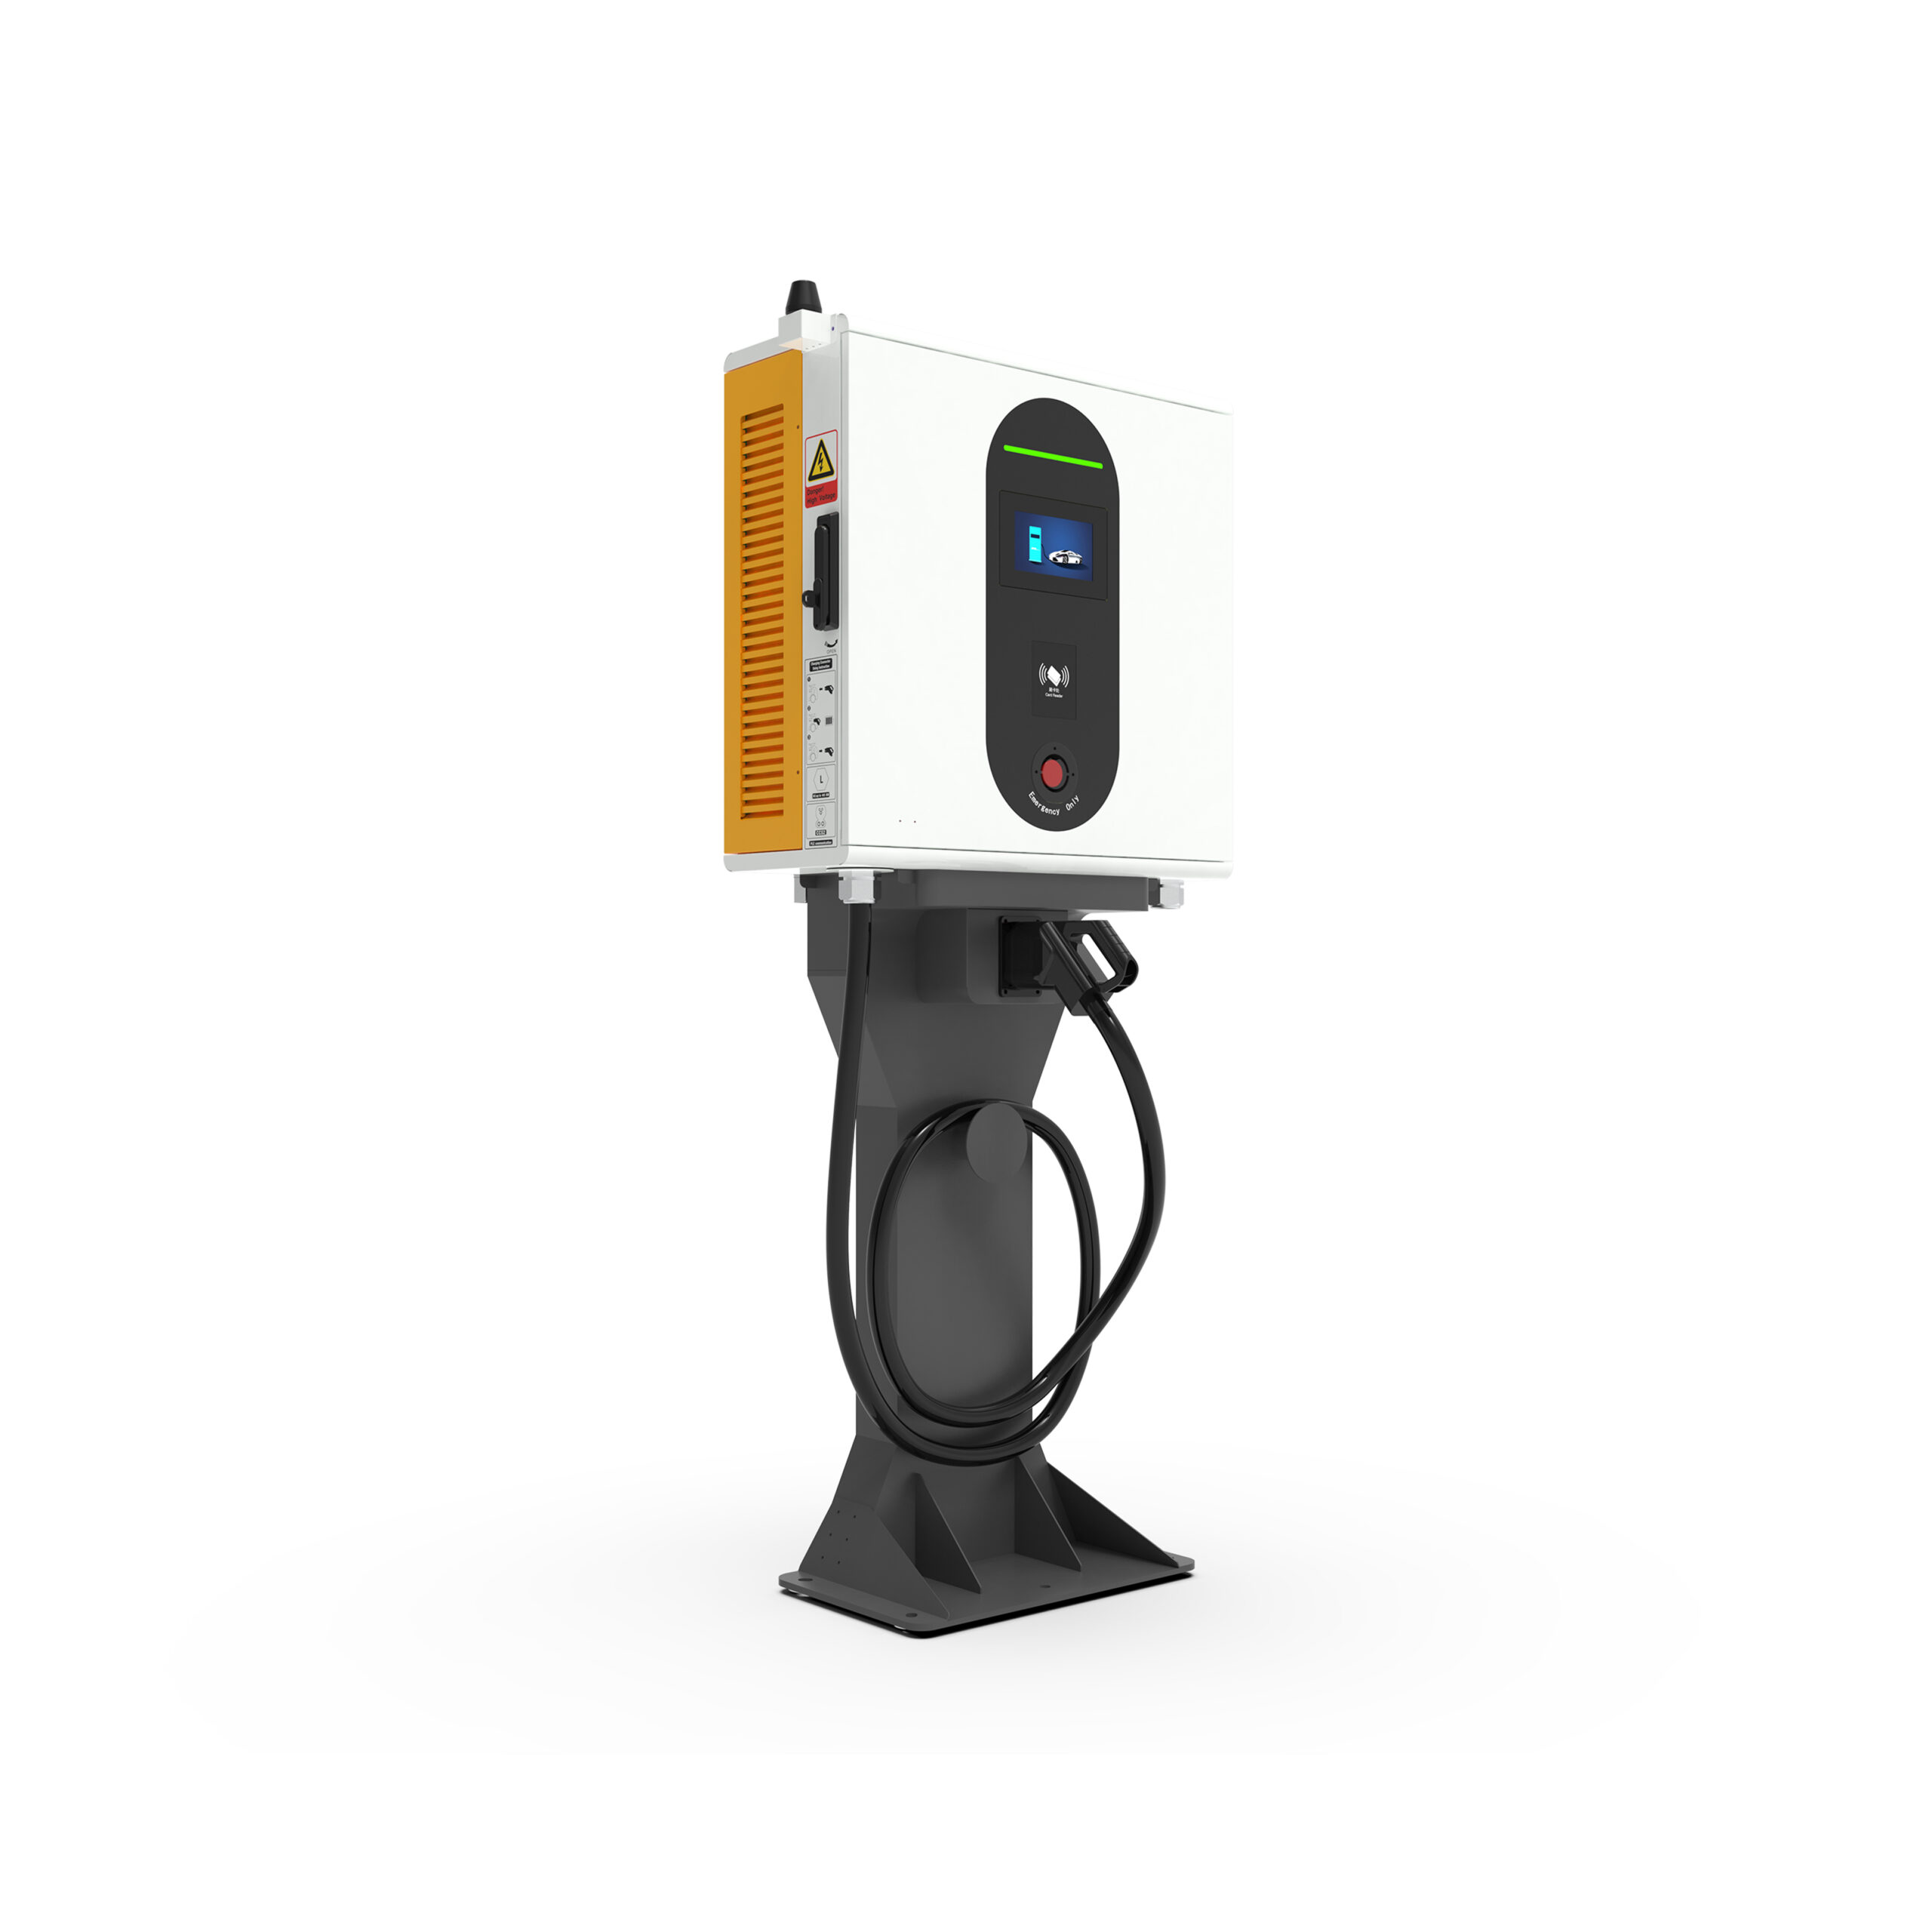
Compare that to classic 30 kW gear: simpler, cheaper, but often limited by heat and cloud round-trips. The 40 kW option widens the window when real power is available, not just promised. It trims the “dead air,” improves time-to-first electron, and smooths queue math. The takeaway from earlier sections holds: the bottleneck was never only kW. It was orchestration, handshake cadence, and how the site defends itself from peak charges. To choose well, use three checks. 1) Effective kWh per hour across a full shift, including thermal derating and restarts. 2) Median handshake-to-energy time measured over 100 sessions (not just the best day). 3) Peak demand mitigation: kW shaved per session during your utility’s worst interval. Meet those three, and your choice—30 kW or 40 kW—will match your routes, not just your specs. For steady guidance and practical engineering depth, see winline technology.